You need: a .kml or .kmz file — you can start with the example below · Last updated: September 11, 2026 You received a development drawing and need to understand its plots before a meeting. In Morada OS, you can request an overview, inspect part of the drawing, and take the data into a spreadsheet, all in the same conversation. This recipe uses a fictional development with two plots, Rua das Acácias, a gatehouse, and a green space. Lote 01 is marked as available and Lote 02 as reserved. These details belong to the example; they do not represent properties for sale.
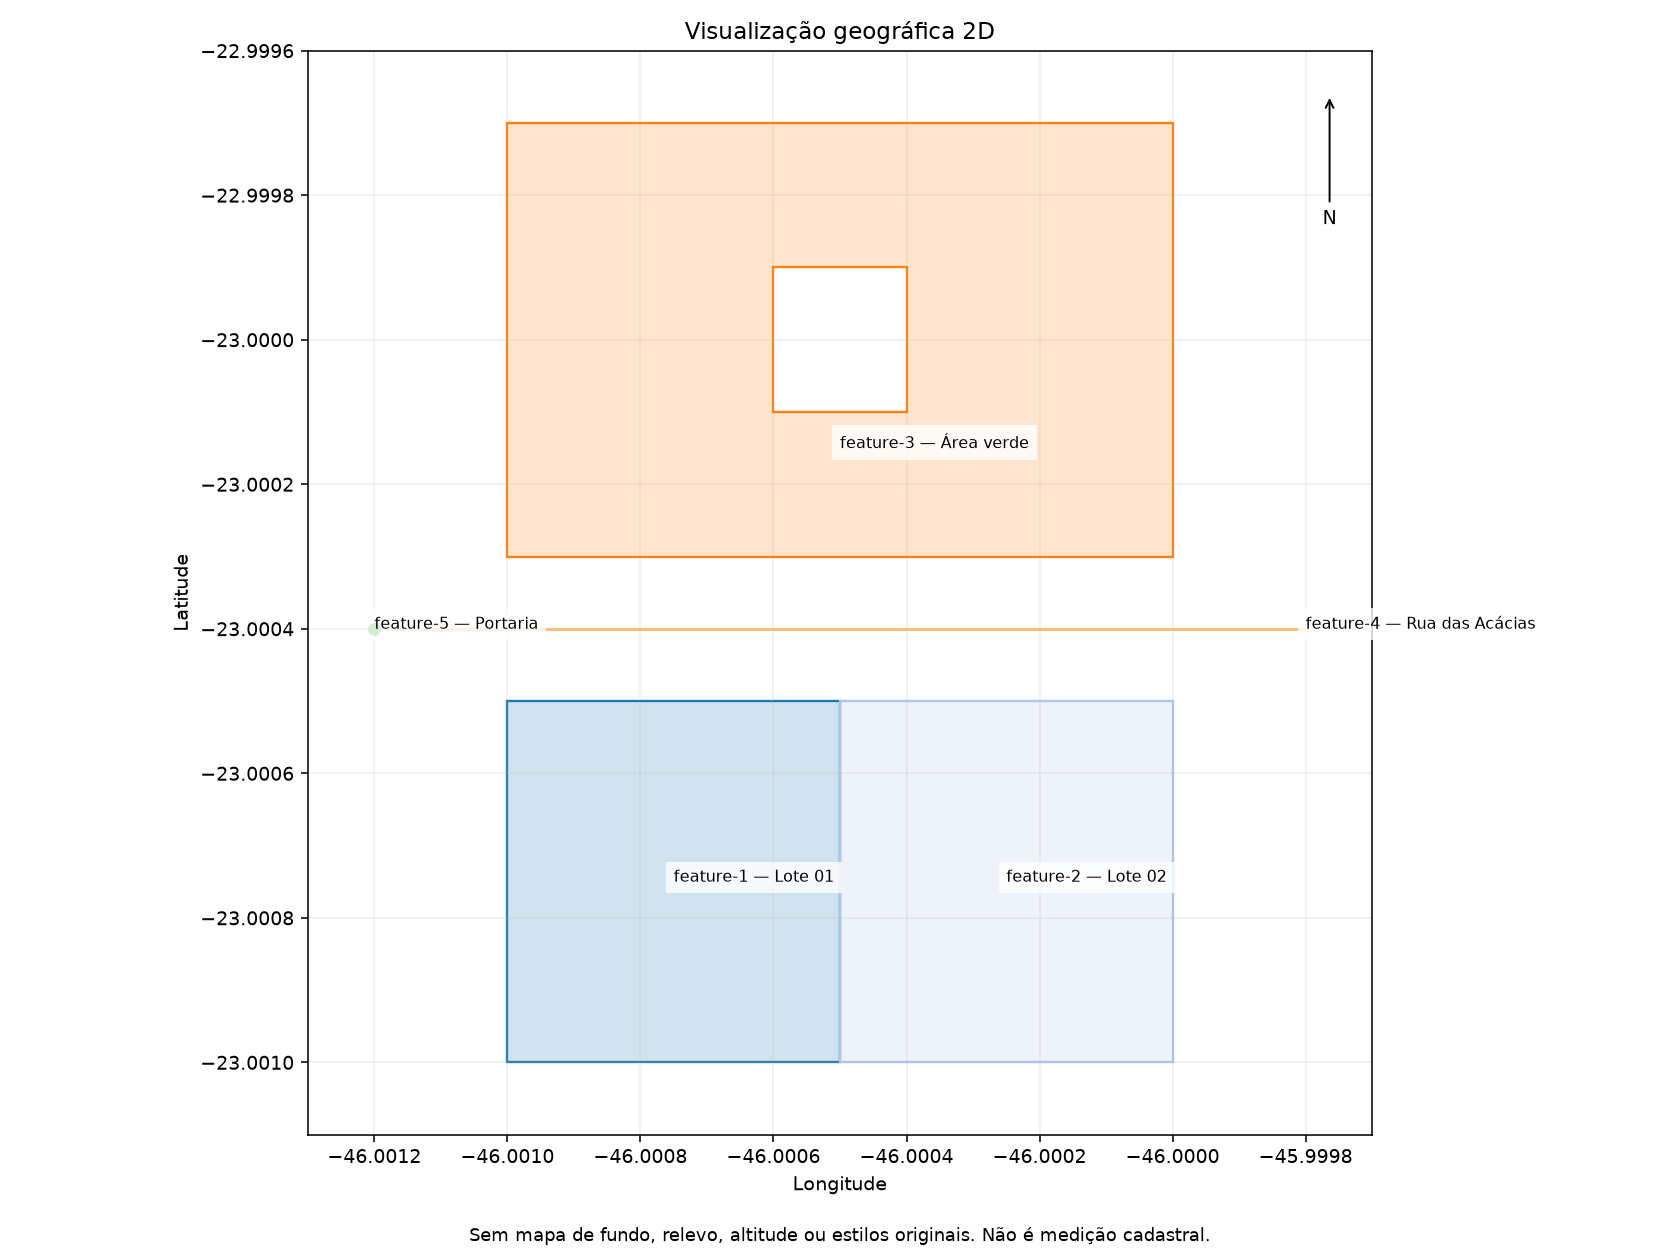
Example development map with Lote 01, Lote 02, Rua das Acácias, Portaria, and Área Verde

Schematic map of the fictional development. Use the names to match each feature to the answers and spreadsheet.

KML stores geographically positioned points, paths, and boundaries, such as a property’s outline in Google Earth. KMZ is a compressed package containing KML and sometimes other files. To practice, download the example and attach it in chat. The screenshots and file names are in Portuguese. The interface labels below match the Portuguese product; the requests are translated into English and keep the feature names from the file.

1. Open the file and understand the layout

1

Download the example

. Save the file on your computer; you do not need to decompress it or install another program to analyze it in OS.If you prefer your own file, adapt the requests to the features it contains.
2

Attach it in a new chat

Open Conversas → Novo chat (Conversations → New chat) and drag the KMZ into the message box. Check that the attachment appears before sending.
Morada OS message box with the KMZ attached and a request to inspect it

The file and request go in the same message. You do not need to configure a skill to get started.

3

Ask for an overview

Copy the request and click Enviar (Send):
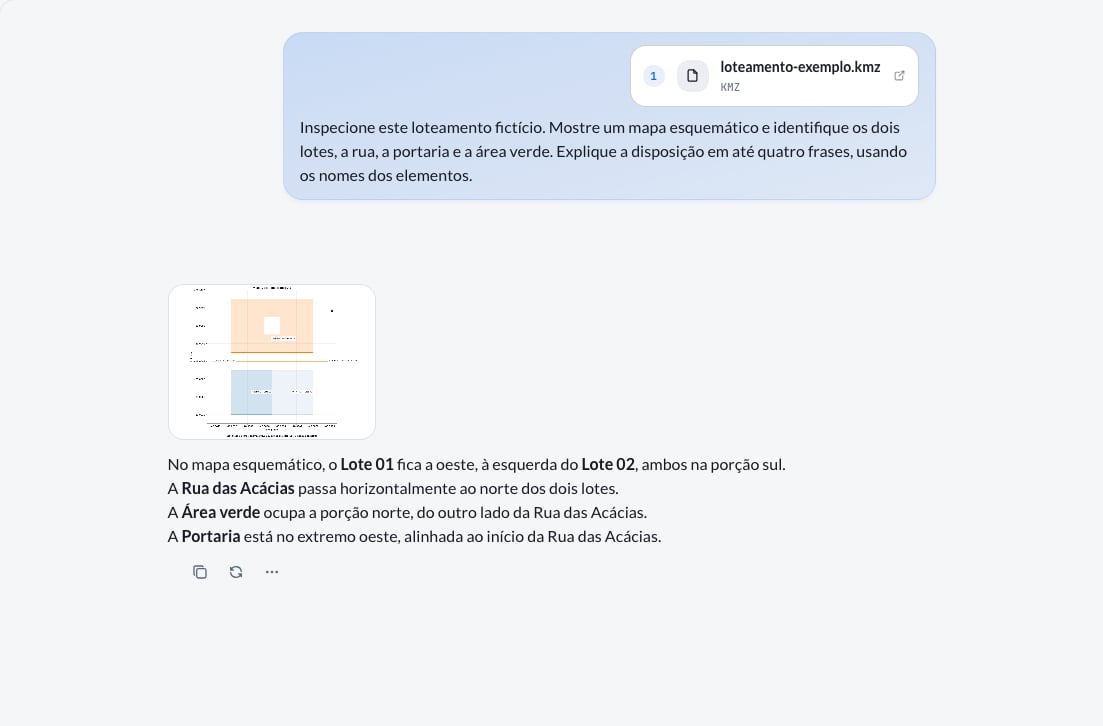
Chat response with the map and an explanation of the development's layout

The overview helps you get your bearings before requesting measurements or filtering data. The demonstration response is in Portuguese.

Click the image in the response to enlarge it; in the viewer, use Baixar (Download) to save the map.Check the names of both plots and their relationship to the road and green space. The empty space inside Área Verde is a cutout in its boundary: the file does not identify it as a lake or another amenity.

2. Inspect a plot up close

Once you understand the layout, choose a feature by name. This helps you inspect a specific plot while keeping track of which record you are analyzing.
1

Ask for the close-up and data

In the same conversation, send:
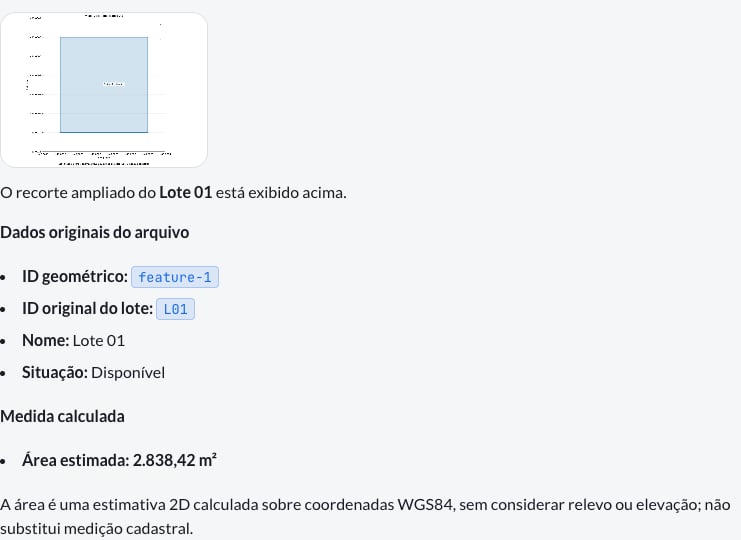
Close-up of Lote 01 in chat, with its data and estimated area

The close-up focuses on the selected plot; the reply brings together its attributes and requested measurements.

2

Check what came from the file

In the example, disponível (available) is a status stored in the file. The estimated area is calculated from the boundary. This distinction matters: the assistant can calculate a measurement, but it should not infer sales availability from how the map looks.If your file has repeated names, use the identifiers in the response to distinguish the features.

3. Take the plots into a spreadsheet

To prepare for the meeting, ask for a table you can filter, sort, or share with your team.
1

Ask for Excel

Continue in the same conversation:
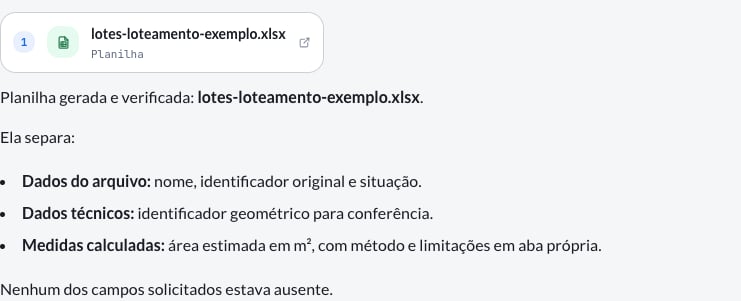
Morada OS response with an Excel spreadsheet of both plots for download

The spreadsheet arrives as a file in the conversation, ready to download.

2

Download and check the records

Download the spreadsheet from your conversation and check that names and identifiers match the map features. You can also .The downloadable copy preserves the data generated by the OS; its column descriptions have been simplified for readability.This sample from the Lotes worksheet shows the original names, identifiers, and statuses alongside the calculated areas:On small screens, swipe across the table to see all columns.The example spreadsheet is in Portuguese; the column labels and statuses above are translated for this guide. Areas are rounded to two decimal places for this display only. The downloadable spreadsheet retains the calculated values.Compare each plot’s status with the source file before using the table in a sales presentation.
The images show one demonstration. In your conversation, the wording, framing, and spreadsheet presentation may vary. The data should still match the file you uploaded.

Other ways to use it

These requests are suggestions for further exploration; adapt them to the information available in your file.
Use the comparison to organize the discussion with your team. If you need prices or sales terms, provide an up-to-date source containing that information.
This request helps you prepare a list of records to check without filling gaps by assumption.
To standardize the Excel presentation, you can also ask: “Format the areas with two decimal places without changing their values.” This is a suggested follow-up, not a change applied to the demonstration spreadsheet.Start with inspection to find out which attributes are available. Not every file includes block or sales status information.
Open another chat, attach the new KML or KMZ, and adapt the first request to its features. Reuse the requests in this recipe; to adjust the level of detail, see How to ask well.

What to consider when using the result

  • Size: up to 5 MiB per uploaded file. For KMZ, the KML inside must also be no larger than 5 MiB after decompression. For larger files, export only the region of interest from the original program.
  • Drawing: a schematic 2D representation, without a background map, terrain, altitude, or reproduction of original styles. Images and other resources bundled in KMZ may not appear.
  • Measurements: areas estimated from boundaries, useful for exploration and comparison. For cadastral measurements or project decisions, check the technical documentation and the responsible professional’s measurements.
  • Formats: this workflow accepts KML and KMZ. DWG is not yet supported.